Bitcoin Reclaims $79,000 as Leverage Builds, but Spot Demand Lags

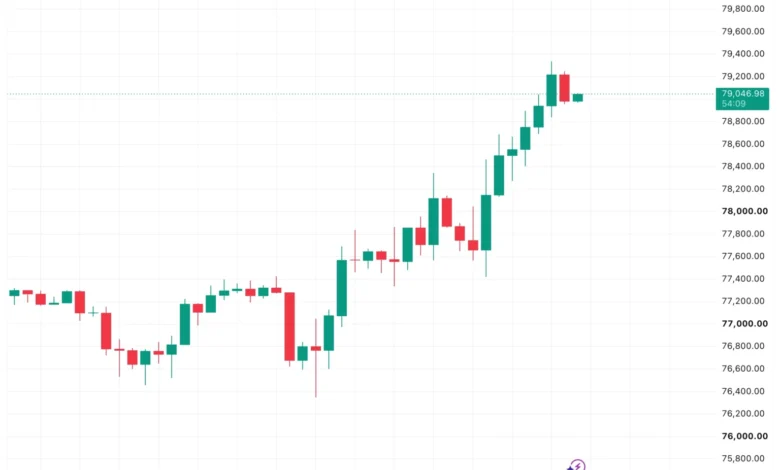
- Bitcoin rebounded from $76,347 to $79,337 in a sharp intraday recovery.
- Open interest climbed 4.26% over 24 hours to $53.82 billion, according to CoinGlass.
- Short liquidations accelerated as BTC pushed above $79,000.
- CryptoQuant shows broader spot demand remains weaker than perpetual futures demand.
Bitcoin climbed back above $79,000 on Sunday after buyers erased an early sell-off and pushed the cryptocurrency nearly 3% higher during the session.
BTC fell as low as $76,347 before reversing sharply and reaching $79,337 on Coinbase. The move returned Bitcoin to the upper portion of its recent trading range and placed the market directly beneath one of its most important technical barriers heading into the new week.
While price action has improved considerably over the short term, derivatives data suggests growing leveraged participation behind the rally, whereas broader spot demand has yet to deliver the same confirmation.
Buyers Defend the Lower End of the Range
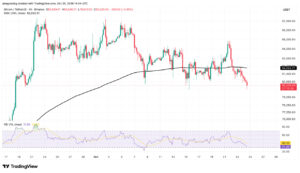
The daily chart shows a decisive rejection of lower prices after Bitcoin briefly traded below $76,500 before recovering almost $3,000.
That response reinforces the lower boundary of the broader consolidation that has defined trading since Bitcoin’s August rally from roughly $62,000.
Despite Sunday’s strong rebound, the larger structure still resembles a range rather than a confirmed breakout. BTC continues to trade beneath the upper boundary formed by previous highs near the low-$82,000 region, leaving the broader trend unresolved.

Short-Term Momentum Turns Positive
The one-hour chart tells a more constructive story.
Following the rebound from the mid-$76,000s, Bitcoin established a sequence of higher lows followed by higher highs, signalling that buyers regained control of short-term market structure.
BTC reclaimed both $77,000 and $78,000 before extending the advance above $79,000, while each pullback remained relatively limited compared with the preceding push higher.
That progression strengthens the bullish intraday setup, although momentum alone does not remove the resistance sitting immediately overhead.

$79,300 – $80,000 Becomes the Critical Technical Barrier
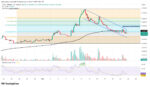
Zooming out to the four-hour chart places Sunday’s rally into perspective.
Bitcoin is now testing a cluster of previous highs between approximately $79,300 and $80,000, an area where earlier advances repeatedly lost momentum.
The latest high of $79,337 reached the lower edge of that resistance zone but did not yet establish a confirmed breakout.
A sustained four-hour move above the region would strengthen the technical case for a continuation toward $80,000 and potentially reopen the path toward the upper end of the broader range near $81,000–$82,000.
Conversely, another rejection would indicate that Bitcoin remains contained within the same consolidation structure despite the strong intraday recovery.

Leverage Expands as Short Sellers Come Under Pressure
Derivatives activity increased alongside the price recovery.
According to CoinGlass, Bitcoin open interest reached $53.82 billion, rising 4.26% over the past 24 hours and 0.72% over four hours.

The simultaneous increase in price and open interest indicates that fresh leveraged positions are entering the market rather than the move being driven solely by the closure of existing contracts.

Liquidation data adds another layer to the rally. Across the broader crypto market, CoinGlass recorded $100.47 million in short liquidations during the latest four-hour window, compared with just $9.48 million in longs. Over the most recent hour, short liquidations reached $52.64 million versus $2.93 million on the long side.
The imbalance suggests that forced short covering helped accelerate the advance, although rising open interest shows the market is also accumulating new exposure as Bitcoin approaches resistance.
Spot Demand Remains the Missing Confirmation
The strongest note of caution comes from the underlying demand data.
CryptoQuant’s 30-day demand growth indicator shows perpetual futures demand remaining positive while spot demand continues to stay in negative territory. Total demand growth also remains below zero.
Because the indicator measures a 30-day trend, it should not be interpreted as evidence that Sunday’s rally was driven entirely by derivatives. Instead, it highlights that the broader recovery still lacks the same level of sustained participation from spot buyers.
That divergence becomes increasingly relevant as Bitcoin challenges a resistance area that has rejected previous rallies.

Outlook
Bitcoin enters the new week with stronger short-term momentum after one of its sharpest intraday recoveries in recent sessions.
The technical picture now depends less on the rebound itself and more on whether buyers can convert the current test of overhead resistance into sustained acceptance above it.
A successful breakout would strengthen the case for another attempt toward the upper boundary of the recent range, while failure to hold the latest gains would reinforce the view that Bitcoin remains locked inside consolidation rather than beginning a new directional move.
For now, price momentum favors buyers, but the broader demand picture remains incomplete – making the market’s reaction around $80,000 the defining signal to watch next.