Dogecoin Breakdown Risk Grows Below Key Support

TL;DR
- DOGE has slipped below $0.0713, but the daily candle remains open.
- A late recovery could return price inside the descending triangle.
- A confirmed breakdown would bring $0.069 back into focus.
- Dogecoin remains below all three major moving averages.
Dogecoin is testing whether a month-long support floor has finally given way.
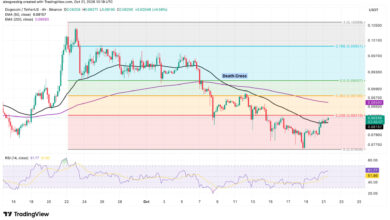
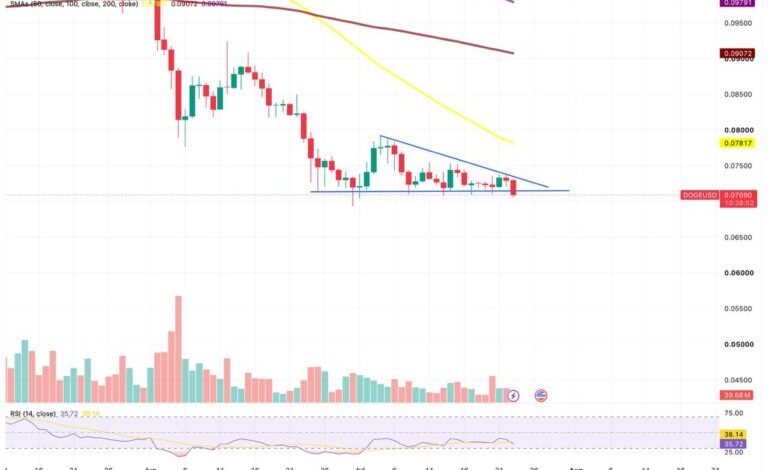
DOGE trades near $0.0711 after slipping beneath $0.0713, the horizontal level that has supported price since early July. The current session reached approximately $0.0705, but the daily candle was still open at the time of writing.
That leaves the breakdown unconfirmed. An intraday move below support can be reversed before the close, while a completed candle beneath the level would carry more technical weight.
The distinction is particularly important here because DOGE remains inside a broader downtrend. Price is below its 50-day, 100-day and 200-day simple moving averages, meaning even a successful recovery above $0.0713 would initially represent stabilization rather than a confirmed reversal.

The Daily Close Decides the Triangle
The current structure has formed through a combination of stable support and progressively lower recovery highs. Buyers repeatedly defended the $0.0713 area, while sellers entered at lower levels along a descending trendline.
Reclaiming $0.0713 before the session ends could place DOGE back inside that structure and reduce the significance of the intraday break.
The first resistance would then sit near $0.0735, where the descending trendline currently passes. The July 21 and July 22 highs around $0.0738 form a second nearby barrier.
A move through that area could weaken the sequence of lower highs, although the falling 50-day simple moving average near $0.07818 would still limit the broader recovery attempt.
The relative strength index provides a mild counterpoint to the bearish structure. RSI is near 36 and has produced a higher low compared with July 13, even as DOGE moved to a slightly lower price low.
That divergence could indicate that selling momentum is easing. It is not enough to confirm a recovery without price first reclaiming the broken floor and then challenging the descending resistance line.
What a Confirmed Breakdown Could Expose
A daily close below $0.0713 would provide stronger evidence that the descending triangle has resolved lower.
The next visible support would sit near $0.069, the June 30 low and the lowest price shown on the chart. That area could produce another reaction, but it has not been tested enough to qualify as a broad support base.
If $0.069 also fails, the conventional measured objective of the triangle sits near $0.0634, approximately 11% below the current price.
That figure is a technical projection rather than a price forecast. It is calculated from the height of the pattern and does not account for changes in volume, wider market conditions or buying demand that could appear before the target is reached.
| Price Signal | Possible Technical Meaning |
|---|---|
| Recovery above $0.0713 | The intraday breakdown could be neutralized, returning DOGE inside the triangle. |
| Move above $0.0735–$0.0738 | The descending resistance and latest recovery highs could begin to weaken. |
| Reclaim of $0.07818 | Price would recover the 50-day average, providing a more meaningful structural improvement. |
| Daily close below $0.0713 | The triangle breakdown would gain confirmation, placing $0.069 at risk. |
| Loss of $0.069 | The measured objective near $0.0634 could become a relevant downside reference. |
The Larger Trend Still Favors Sellers
DOGE remains beneath the 50-day average at $0.07818, the 100-day average near $0.09072 and the 200-day average around $0.09791.
The averages are arranged in bearish order, with the shorter-term measure below the longer-term ones. Their separation shows that the weakness extends beyond the current triangle.
This means a return above $0.0713 would not automatically reverse the broader trend. It could keep DOGE inside its recent consolidation and create room for a bounce, but stronger evidence would require price to clear the descending trendline and begin reclaiming the moving averages.
Conversely, the bearish alignment does not guarantee that the measured downside objective will be reached. It establishes the prevailing direction, while the daily close determines whether the latest support break adds momentum to it.
Regulated Access Has Expanded, but Demand Looks Limited
Dogecoin now has regulated US investment products that allow exposure through conventional brokerage accounts.
The 21Shares Dogecoin ETF reported approximately $2.77 million in assets under management as of July 22. The Grayscale Dogecoin Trust ETF provides another spot-based route to DOGE exposure.
The availability of those products expands access, but it does not by itself demonstrate enough demand to change the current price structure. The TDOG asset figure remains modest, and assets under management can change because of DOGE’s price as well as investor deposits or withdrawals.
Sustained fund creations would provide a clearer demand signal than product availability alone. Until then, the ETFs are better viewed as additional infrastructure around Dogecoin rather than evidence that institutional buying is already driving the market.
Merchant Access Is Growing, but Usage Data Matters More
Dogecoin’s payments infrastructure is also expanding.
House of Doge, the corporate arm and innovation partner of the Dogecoin Foundation, says its partnership with MoonPay has added native DOGE payment support across more than 6,000 merchants, including real-time settlement tools.
That could make Dogecoin easier to use in ordinary transactions. However, merchant availability should not be confused with actual adoption. A business being able to accept DOGE does not show how often customers select it or how much payment volume moves through the system.
Future disclosures on transaction value, repeat use and active merchants would offer stronger evidence of whether the expanded infrastructure is producing meaningful demand.
The Pattern Remains Conditional
The immediate technical question is narrow: whether DOGE finishes the daily session above or below $0.0713.
A recovery before the close could turn the current move into another test of the triangle floor. A completed candle beneath it would make $0.069 the next visible support and increase the relevance of the lower measured objective if that level also fails.
The RSI divergence suggests that bearish momentum may be losing some strength, but the moving-average structure still favors caution. ETF availability and broader merchant support add context around Dogecoin, yet neither development overrides the price action currently unfolding at support.